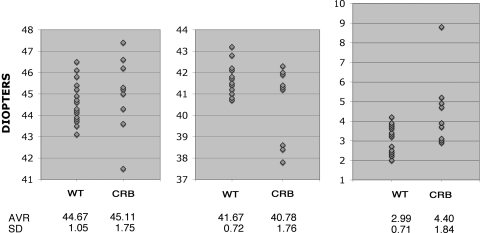
Figure 5.
Measurements of corneal curvature in controls (WT) and in homozygous carriers of CRB1 mutations (CRB). Measurements of the steepest point on the cornea (left), the flattest point (middle), and the difference between the two (right) are provided. The vertical axis shows dioptric values, and the horizontal axis shows genotypes. Averages and standard deviations are provided below each graph.

