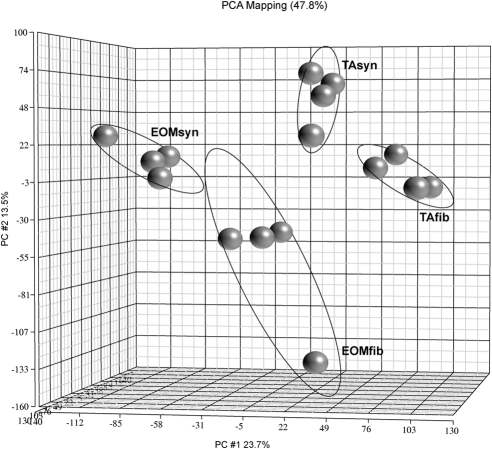
Figure 2.
PCA and 3D visualization of EOMsyn, EOMfib, TAsyn, and TAfib microarray data. Shown is the 3D scatterplot of the PCA performed on the samples. Each gray ball represents gene clustering of a replicate of each sample (i.e., the EOMsyn, EOMfib, TAsyn, or TAfib gene microarray), not a gene. Ellipses around the groups represent an SD of 2. PCA captured 47.8% of the variation observed in the experiment in the first three principal components, which are plotted on the x, y, and z axes, representing the largest fraction of the overall variability in samples.

