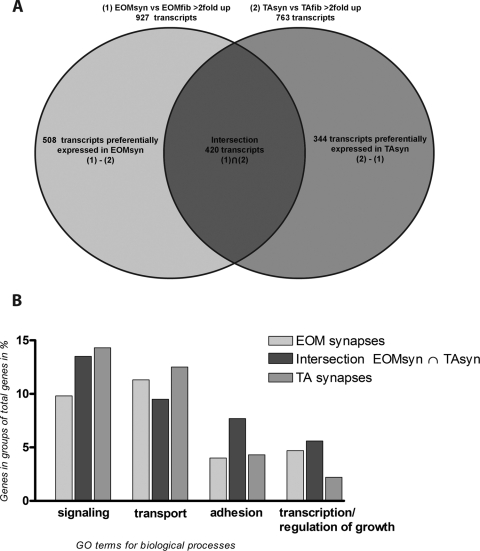
Figure 4.
Venn diagram of intersection and GO annotations of expression profiling datasets. Venn diagram (A) shows the intersection of transcripts that were detected at greater than a twofold cutoff for the datasets EOMsyn versus EOMfib (set 1) and TAsyn versus TAfib (set 2). Data were sorted for genes that both profiles had in common (intersection; 420 transcripts) and genes that were found in either EOMsyn (508 transcripts) or TAsyn (344 transcripts). After the unknown transcripts had been substracted, the known genes of the intersection (288 genes), EOMsyn (275 genes), and TAsyn (230 genes) were also sorted for their involvement in biological processes by their GO annotations and are shown in (B).

