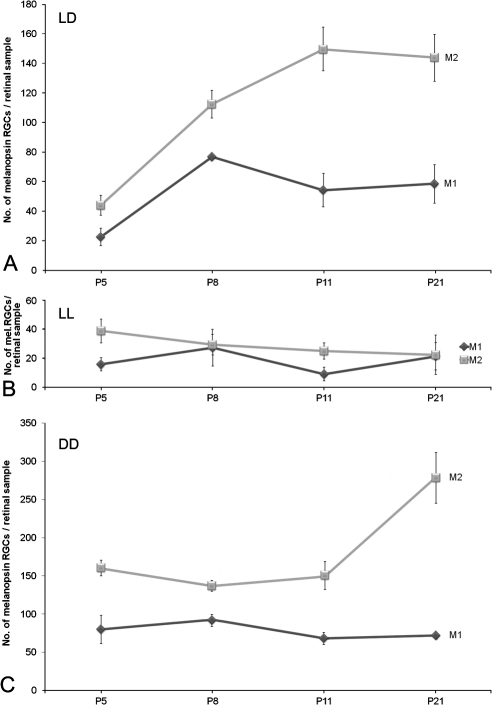
Figure 4.
(A) Development of M1 and M2 cells under LD conditions. No global differences were detected (factorial ANOVA; P > 0.05). One-way ANOVA performed separately for each subpopulation revealed significant increases in number for M1 (P < 0.05) and for M2 (P < 0.001) cells. Both subpopulations showed an initial parallel increase between P5 and P8 (P < 0.01). (B) Postnatal development of M1 and M2 cells under LL conditions. No global differences were detected (factorial ANOVA: P > 0.05). (C) M1 and M2 cells under DD. M1 cell number did not change during development, whereas M2 cell number showed a significant increase at the late postnatal period (P < 0.01). n = 4 animals per group.

