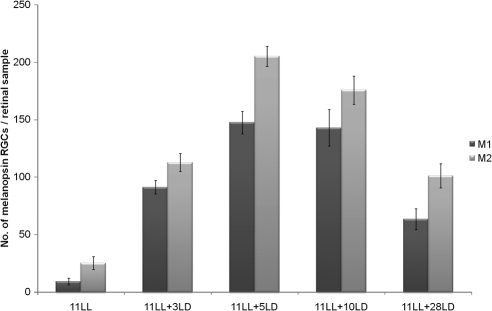
Figure 7.
Increase in the number of M1 and M2 cells under LD after the severe decrease induced by LL. Both cell subpopulations showed an increase in numbers during the first days of the LD period (P < 0.001). Afterward a decrease (P < 0.001) was observed, and the values reached the standard ones observed in the LD controls. n = 4 animals per group.

