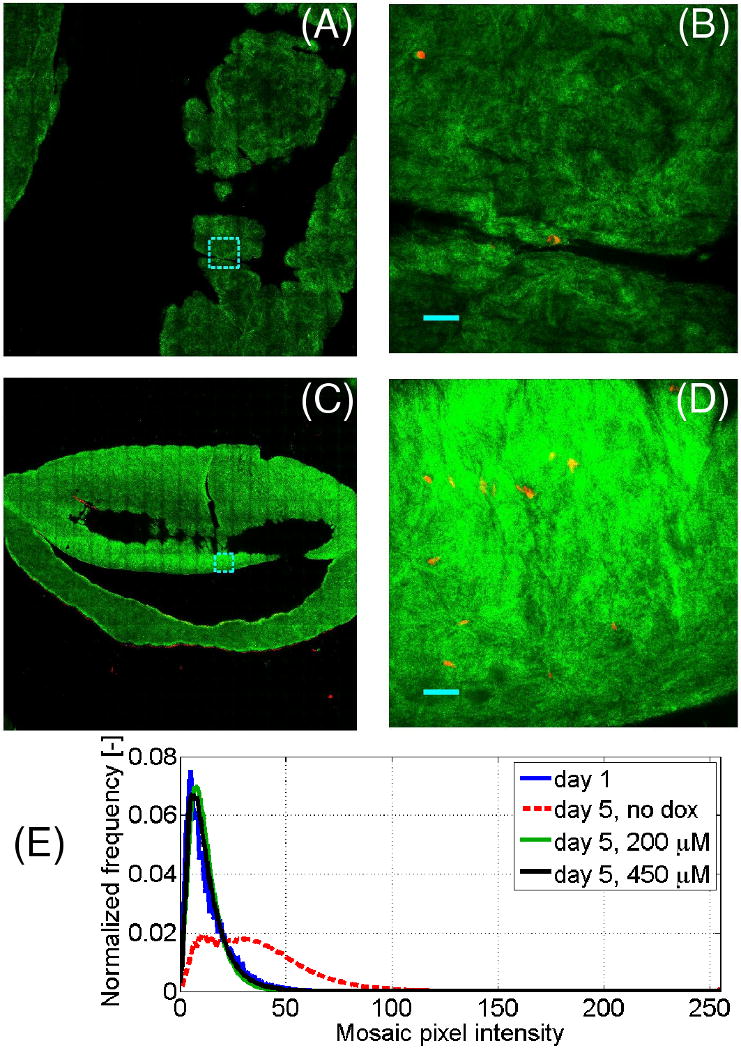
Fig. 1.

Representative confocal mosaics of collagen gels, with the reflectance signal (green) representing collagen and eosin fluorescence signal (red) representing cell cytoplasm. (A, C) Representative 0.6 × 0.6 cm mosaics of day 1 and day 5 collagen-SMC gels, respectively, with representative 500 × 500 μm tiles shown at higher magnification in (B, D), respectively. Note that in (A-D) the reflectance signal was digitally boosted 3-fold. (E) Statistical distribution of pixel intensities of the collagen-SMC gels outlined in the reflectance mosaics that quantify the reflectance increase in the day 5, dox- gels. Tile shown in (B) and (D) represent 500 × 500 μm, are outlined in cyan in (A) and (C), respectively. (B, D): Bar = 50 μm.
