
Fig. 1.
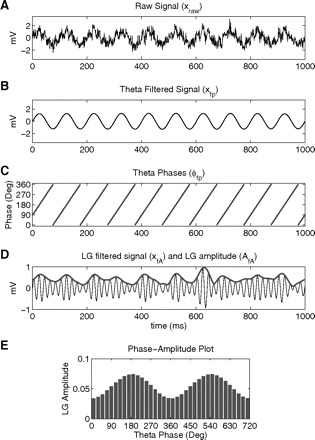
Steps in the computation of the phase-amplitude plot and modulation index (MI). The raw signal (A) is filtered at the phase (B) and amplitude (D, thin line) frequency ranges of interest. Next the phase (C) and the amplitude (D, thick line) time series are calculated from the filtered signals by using the Hilbert transform. A composite phase-amplitude time series (ϕfp, AfA) is then constructed and used to obtain the mean amplitude distribution over phase bins (E; 2 cycles shown for clarity). The MI is obtained by measuring the divergence of the observed amplitude distribution from the uniform distribution. See text for further details. LG, low-gamma (30–60 Hz).