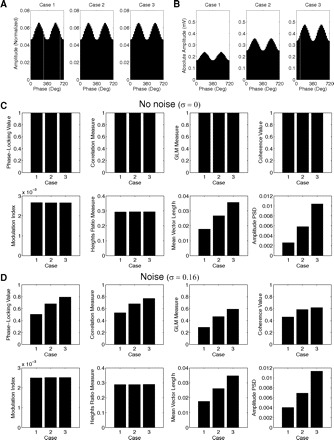
Fig. 10.

Influence of the absolute amplitude of the amplitude-modulated band on the coupling measures. A and B: 3 cases of identical coupling strength, but differing in the absolute amplitude of fA are shown. Panels in A show the normalized amplitude (i.e., the distribution-like function P; see methods), whereas panels in B show the absolute mean amplitude level per phase bin for the same 3 cases. C: CFC measures values for the 3 cases depicted in A and B in the absence of noise. D: same as the above, but in the presence of noise.
