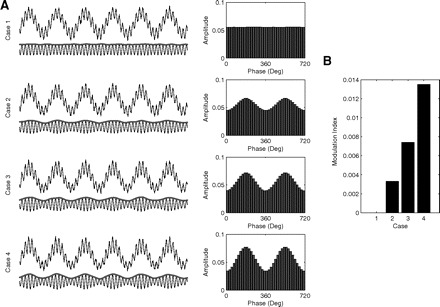
Fig. 2.

Modulation index performance in assessing phase-amplitude coupling. A, left: 4 cases differing in coupling strength are shown (top traces) along with their corresponding phase-amplitude plots (right panels). The thin and the thick traces plotted underneath show the LG filtered signal and its amplitude envelope, respectively. B: MI values for the 4 example cases shown in A.
