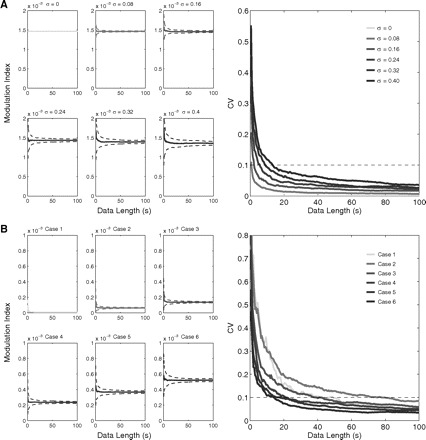
Fig. 3.

Dependence of the MI on the data length. A: plots in the left show the mean MI value as a function of the data length for 6 cases of theta–LG coupling differing in noise intensity (σ2 is the variance of the white noise process; see appendix). Dashed lines denote ±SD; 100 trials were simulated for each parameter set. Notice that the mean MI approaches a steady value and that the variance among trials gets reduced with longer data lengths. The corresponding coefficient of variation (CV) levels are shown in the right plot. B: CV levels (right plot) as a function of the data length for 6 cases of theta–LG coupling differing in coupling strength (left plots). Noise level was fixed at σ = 0.24.
