
Fig. 7.
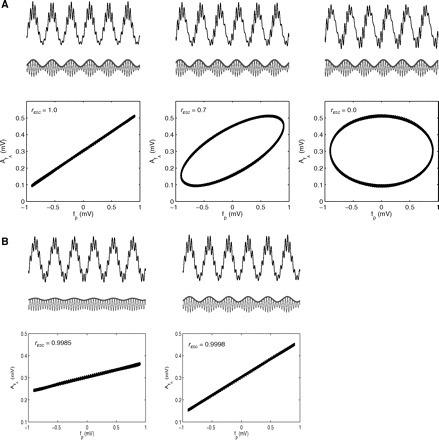
Assessing the linear regression between the amplitude envelope AfA and fp. A, top panels: 3 cases of phase-amplitude coupling presenting the same intensity (as judged by the amplitude envelope) but different coupling phases (top trace: synthetic LFP; bottom traces: gamma filtered signal (thin line) and gamma amplitude envelope (thick line)). Bottom panels: scatterplots between fp and AfA, which show that the correlation coefficient (rESC) depends on the phase lag between AfA and fp. B: 2 cases differing in CFC strength. Notice that the correlation coefficient provides similar results, since it does not depend on the slope of the regression nor on its y-intercept. Therefore CFC measures dependent on the regression between AfA and fp do not, in principle, correlate well with its intensity (for better clarity of the proof of principle, no noise was added to the synthetic signals shown in this figure).