Fig. 2.
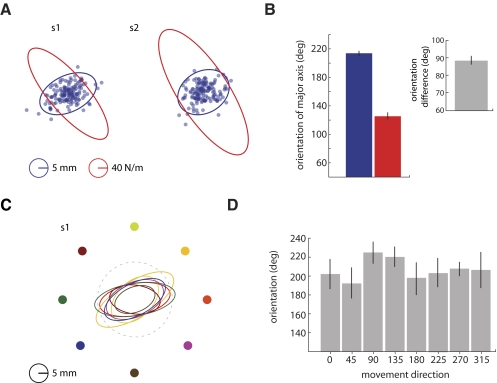
Experiment 1. A shows data from 2 subjects (s1 and s2). Patterns of limb stiffness (red) are related to patterns of movement variability (blue); the difference in average ellipse orientation (B) between stiffness and variability was about 90° (gray bar, B). C shows variability ellipses for each of the 8 movement directions (represented by 8 colors) constructed from s1's end position data. The dashed line represents the target. End position variability was elliptical in shape. The mean orientation of the variability ellipse (D) did not change with movement direction. Error bars represent ±1SE.

