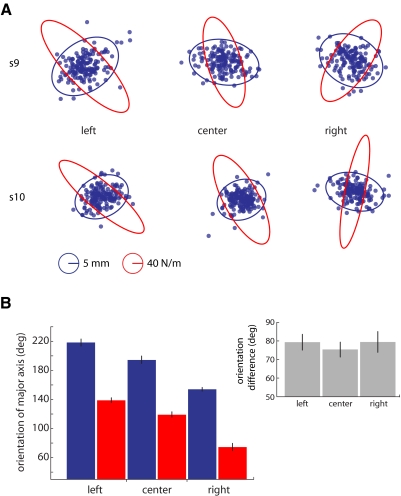
Fig. 4.
Experiment 2. A: shows stiffness (red) and variability ellipses (blue) from 2 subjects, s9 and s10, who made movements in the 3 postures (left, center, right) used in experiment 2. As posture was altered the direction of maximum limb stiffness and movement variability changed systematically (B). The relationship between the 2 did not change (C). Error bars represent ±1SE.

