
Figure 1.
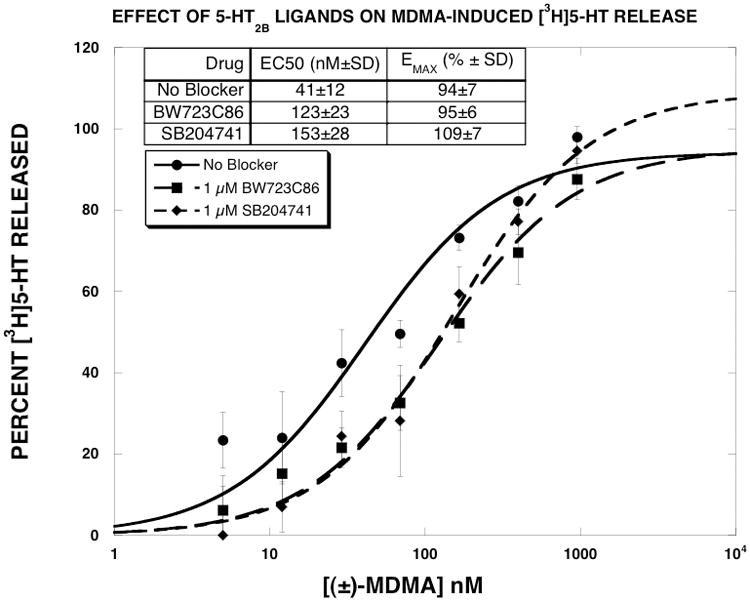
Effect of 5-HT2B receptor ligands on MDMA-induced [3H]5-HT release. MDMA dose-response curves were generated as described in methods. The data of three experiments, expressed as percent [3H]5-HT released, were fit to the dose-response equation for the best fit estimates of the EMAX and EC50 using KaleidaGraph. Each value is the mean±SEM (n=3).