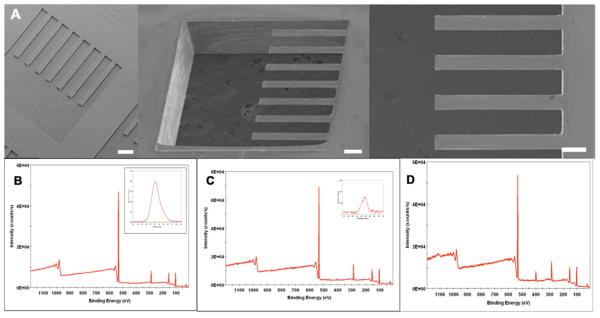
Figure 3. Cantilever analysis and formation of PEG-DETA self-assembling monolayer patterns.
(A) Electron micrograph images of the bio-MEMS cantilevers, (B) XPS survey spectrum of PEG-coated cantilever (insert shows high resolution C1s spectrum), (C) XPS survey spectrum of DETA on PEG-coated cantilever (insert shows high resolution N1s spectrum), (D) XPS survey spectrum of DETA on ablated PEG-coated cantilever.

