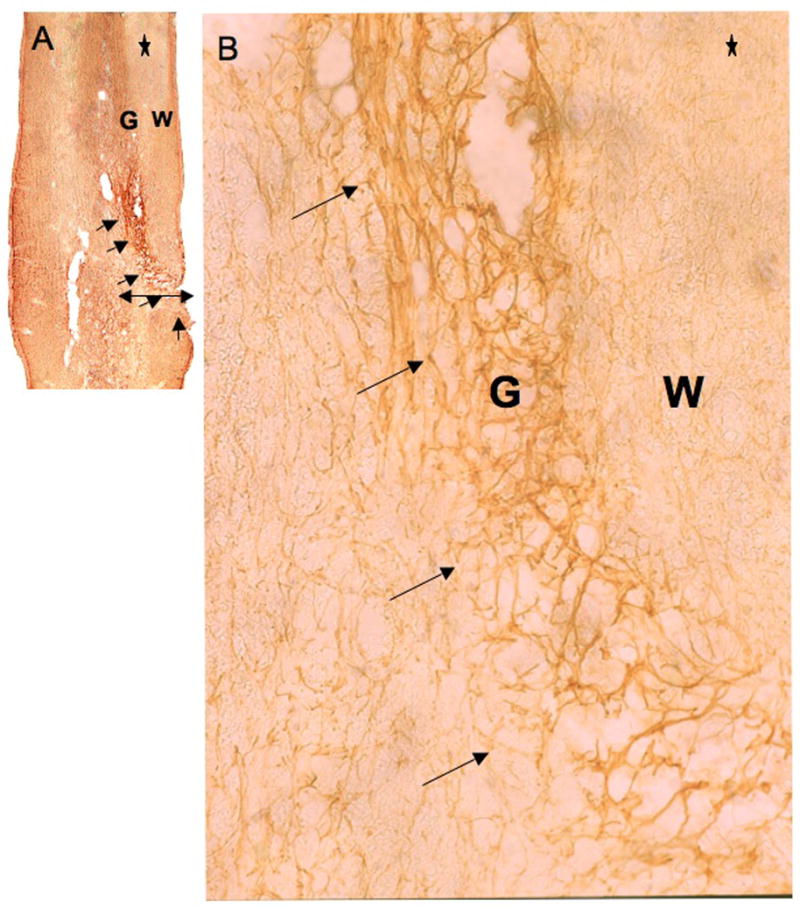
Figure 2.

GFAP IR at the lesion site. The tissue reaction due to lesion is revealed by GFAP-ICC on 30μm cephalo-caudal sections (30μm thickness, using a vibratome) at the site of the lesion (T9). Reactive tissue goes from 1/3 medial to lateral side of the cord, including ventral gray (G) and lateral white matter (W) (as shown by the mediolateral line drawn in the schema of Fig. 1A). Arrows indicate astrocyte-dense tissue area. The extent of the scar is less than 500μm thick and appears well delineated. Astrocytes can be better observed at a higher magnification (B). * indicates cephalic side of the histological section. (A) X5, and (B) X62.5.
