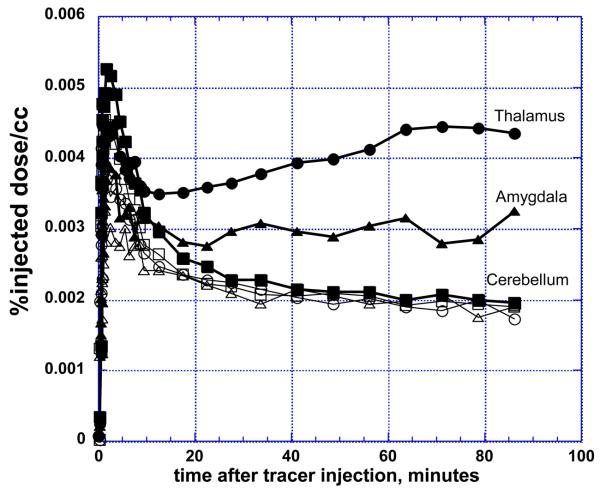
Figure 2. Time-activity curves of [11C]vorozole in human brain regions.
Representative time activity curves in thalamus, amygdala and cerebellum from one subject. Filled symbols depict a baseline (radiotracer only) scan and empty symbols depict a blocking study, with tracer injected 2 hrs after oral administration of letrozole 2.5mg.

