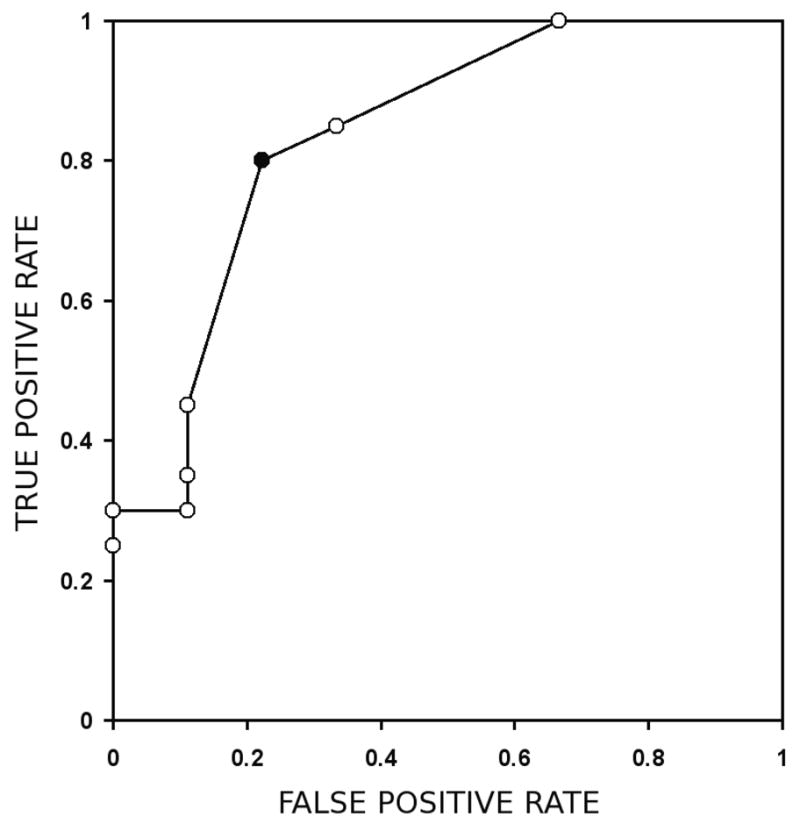
Figure 2.

The ROC curve with a maximum AUC is obtained for Nσ = 6 and, with a ROC AUC of 0.83. The black data point corresponds to the data point with the separation of benign and malignant lesions to the highest level of statistical significance, and is obtained for Nc = 3.
