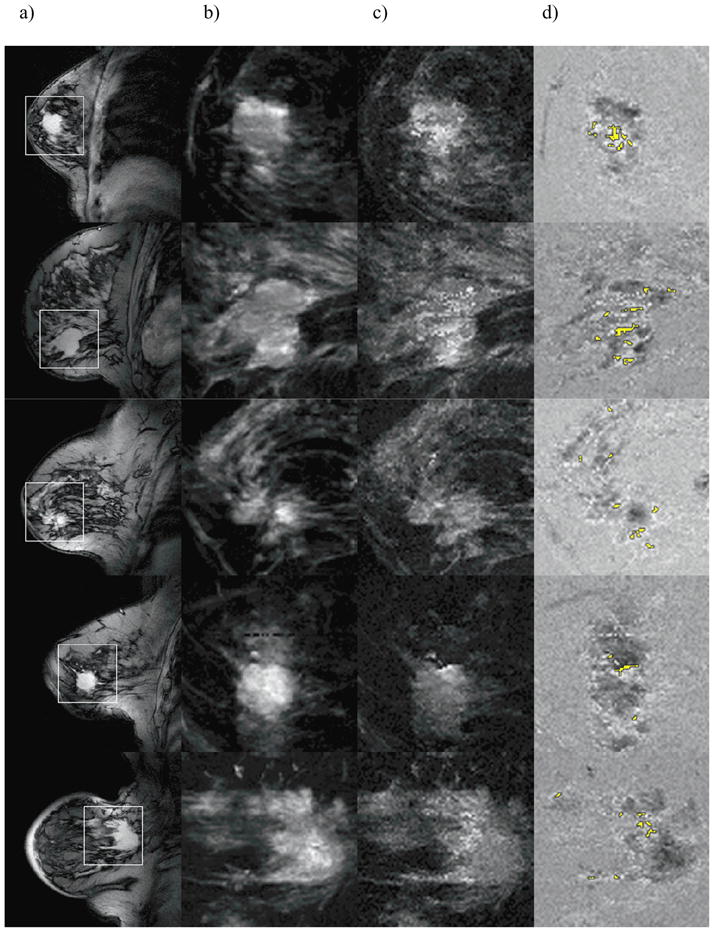
Figure 3.

A T1-weighted (a) image is shown for 5 patients with IDC lesions confirmed on biopsy, and a 5 × 5 cm region surrounding the lesion is outlined by the white square. FCI0 and FCI10 in the outlined region are shown (b and c), and their difference is shown in (d). Broadened clusters are highlighted in yellow. The difference image in (d) was calculated after FCIs were normalized to same average intensity.
