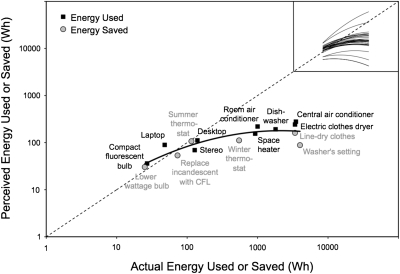
Fig. 1.
Mean perceptions of energy used or saved as a function of actual energy used or saved for 15 devices and activities. Error bars for 95% confidence intervals are omitted because they are typically no taller than the symbols themselves. The diagonal dashed line represents perfect accuracy. Inset: Individual regression curves for 30 randomly selected participants.

