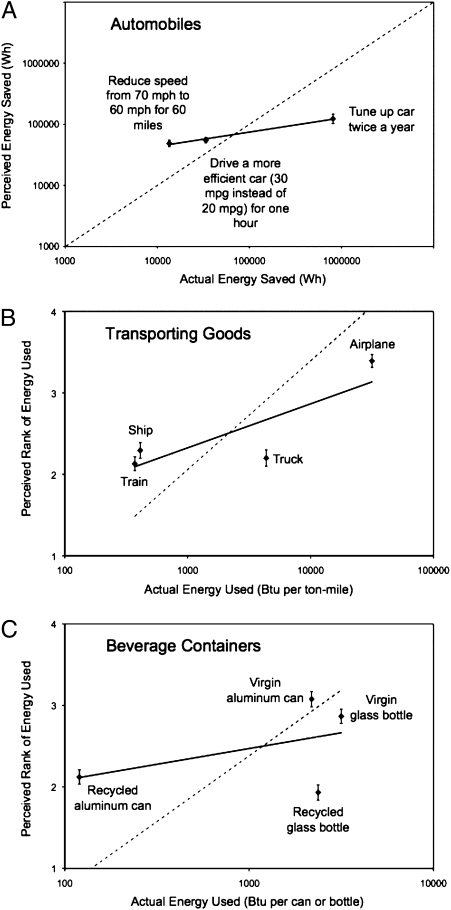
Fig. 2.
Mean perceptions of energy used or saved as functions of actual energy used or saved for automobile-related activities (A), modes of transporting goods (B), and methods of manufacturing beverage containers (C). Error bars indicate 95% confidence intervals for mean perceptions. Diagonal dashed lines represent accurate responses. In B and C, the dashed lines were derived by regressing the correct ranks onto actual energy use.

