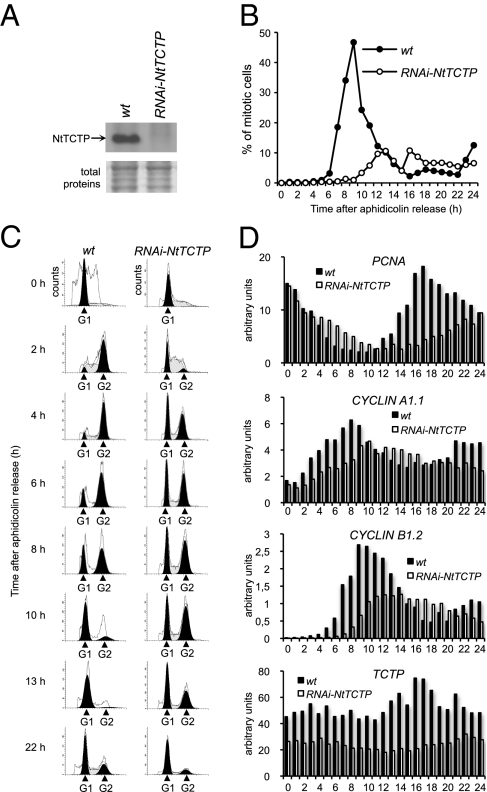
Fig. 4.
Plant TCTP controls cell cycle duration (A) Western blot analysis of NtTCTP protein accumulation in WT and RNAi-NtTCTP BY-2 cells using anti-AtTCTP antibody. Coomassie staining of total proteins is shown as control (Bottom). (B) Mitotic index of synchronized WT and RNAi-NtTCTP BY-2 cells after aphidicholin release (AAR). Note the delay and the decrease of the mitotic peak in RNAi-NtTCTP cells compared with WT. (C) Flow cytometric analysis of DNA content in synchronized WT and mutant BY-2 cells. Note the constant G1 population after AAR in RNAi-NtTCTP cells. (D) Quantitative RT-PCR analysis of cell cycle marker genes (PCNA, cyclin A1.1, and cyclin B1.2) and NtTCTP in synchronized WT and mutant BY-2 cells.

