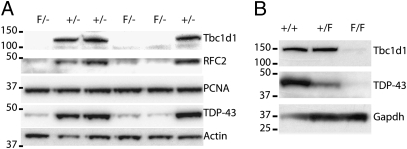
Fig. 4.
Validation of targets identified through deep sequencing analysis. (A) Protein blot analysis of Tbc1d1 and rfc2 from extracts of iTDPKO ES cells treated with 4-HT. Note the dramatic reduction in levels of TDP-43 whereas PCNA is similar in iTDPKO compared with cTDP ES cells. Antisera against actin used as a loading control. (B) Protein blot analysis of Tbc1d1 (Upper) and Tardbp (Middle) in the skeletal muscles of control, CAG-ErCre;Tardbp+/F, and CAG-ErCre;TardbpF/F mice. Note the depletion of TDP-43 and Tbc1d1 in muscle of mice lacking Tardbp. (*P < 0.05, **P < 0.01, ***P < 0.001.)

