Fig. 3.
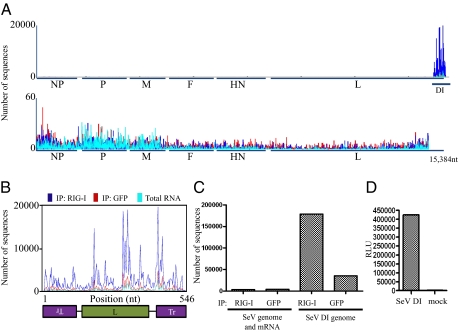
Deep sequencing analysis of RIG-I–associated and control IP RNA from SeV virus-infected cells. (A) RNA from RIG-I IP and control (GFP) IP and total RNA from SeV-infected cells (blue, red, and teal, respectively) were subjected to Illumina deep sequencing. Obtained sequencing reads are mapped to their starting position on the virus genome; the y axis shows the number of sequences mapped to a particular position. (Upper) All sequences mapped to the entire genome are shown. (Lower) The last 484 nt are removed to allow better visualization of the rest of the genome (note the difference in the y scale between Upper and Lower). (B) Sequencing reads mapped to the genome of the DI particle show enrichment for RIG-I–associated sequences throughout the entire DI molecule. (C) Comparison of numbers of sequences that map to the DI genome or the rest of the SeV genome in the RIG-I and control (GFP) IPs. (D) Induction of ISRE-FF reporter by transfection of T7 SeV DI RNA compared with mock transfected cells.

