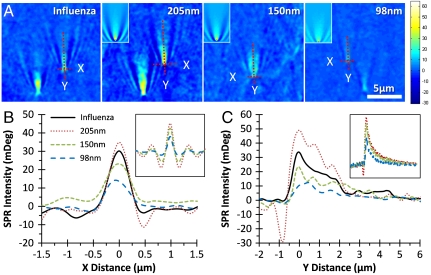
Fig. 2.
(A) SPRM images of H1N1 influenza A virus and three different sized silica nanoparticles in PBS buffer. (Insets) Nanoparticle images generated by numerical simulation. (B and C) The SPR intensity profiles of selected particles along X and Y directions (indicated by dashed lines in A, respectively. (Insets) Corresponding profiles from simulated images.

