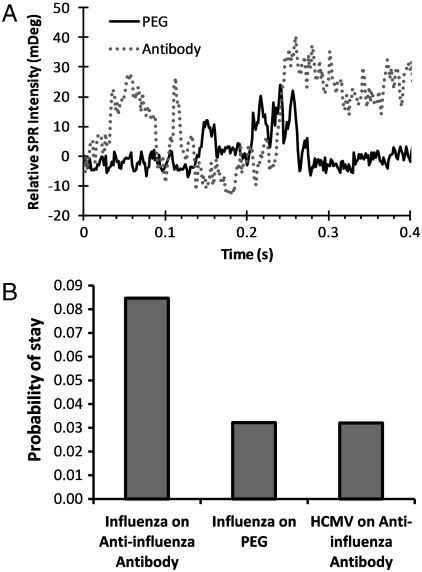
Fig. 4.
(A) SPR intensity vs. time profiles for influenza A viral particles on PEG and antiinfluenza A antibody-functionalized surfaces. (B) Histogram showing relative binding probabilities of influenza A on PEG and antiinfluenza A antibody-functionalized surfaces. The analysis of control experiment, HCMV on antiinfluenza A antibody-functionalized surfaces, is also shown for comparison. Note the vertical axis of the histogram is the probability of a particle stays on the surface (determined from the time profiles similar to A).

