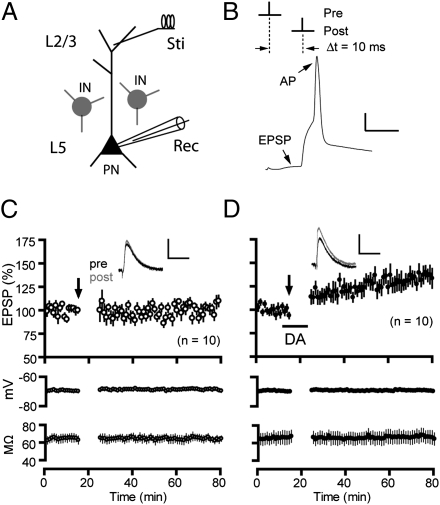
Fig. 1.
Dopamine enables t-LTP in the PFC under intact GABAergic inhibition. (A) Schematic of stimulation and recording configuration. IN, interneuron; PN, pyramidal neuron; Sti, stimulation; Rec, recording. (B) t-LTP induction protocol (Δt = 10 ms). A representative EPSP-AP response during a paired stimulus is shown. (Scale bar: 20 mV, 10 ms.) (C) Lack of lasting changes in EPSP amplitude following t-LTP induction in normal extracellular bath. (D) t-LTP induced in the presence of dopamine (100 μM) applied to the bath during EPSP-AP pairings. Lower panels in C and D show stability of membrane potentials and series resistance during experiments. Insets are averages of five EPSPs recorded 5 min before and 30 min after t-LTP induction (arrows). (Scale bars for EPSPs: 2 mV, 25 ms.) Values in parentheses indicate numbers of cells examined except as noted otherwise.

