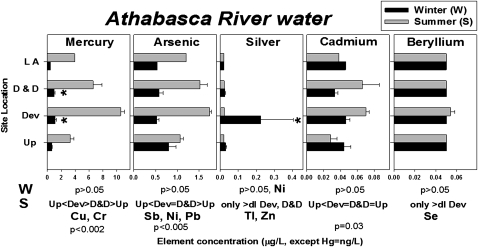
Fig. 3.
Element concentrations (mean ± SE, expressed in μg/L, except for Hg, which is expressed in ng/L) in water from the AR collected in winter (W, black bars) and summer (S, gray bars). Up, AR upstream (n = 3); Dev, AR downstream/near development (n = 7); D&D, AR downstream and Athabasca Delta (n = 6); LA, Lake Athabasca (n = 1); dl, detection limit and only >dl Dev, greater than dl only at sites near development. *Increases near development and downstream that were not statistically significant (power β < 0.171). The distribution of elements listed below panels is similar to that in the panel above, and statistics refer to all elements with similar distributions.

