Fig. 3.
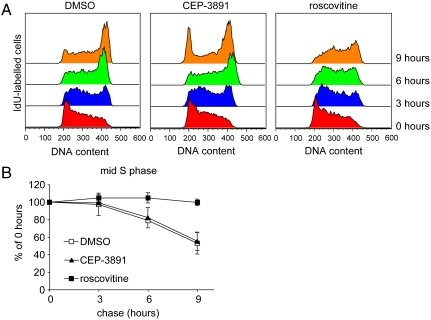
Chk1 inhibited cells display normal S phase length while Cdk inhibition slows S phase progression. (A) Flow cytometry profiles of progression through S phase in presence of DMSO, CEP-3891, or roscovitine. Asynchronously growing U2OS cells were pulse labeled with IdU for 20 min and released into medium containing drug or DMSO. Nuclei were immunostained for IdU and stained for DNA using propidium iodide (PI). Profiles show PI distribution of cells stained for IdU (which were in S phase during pulse label) after 0, 3, 6, or 9 hours (see also Fig. S4). (B) IdU-labeled cells in mid-S phase after 3, 6, or 9 hours release from IdU as percentage of fraction at 0 hours. Means and standard deviation (S.D.) (bars) of three independent experiments are shown.

