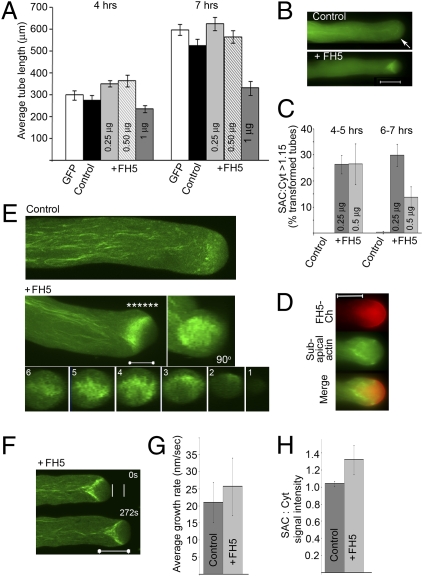
Fig. 2.
FH5 regulates the prominence of the subapical actin structure. Data are from transiently transformed tobacco pollen tubes. GFP-ADF was used as the actin reporter as it most efficiently reveals the subapical actin structure and least adversely affects tip growth among several plant actin reporters (3, 8, 36). Pollen tubes were either transformed by the actin reporter alone (control) or cotransformed by Lat52::FH5 (+FH5). (A) Growth response to FH5 transgene dosage (indicated in data bars). Data are the mean ± SE of the average tube lengths from triplicate samples (with 20–30 tubes per replicate) in one representative experiment. Difference between the +FH5 and control samples were significant (at 4 h, P = 5.8 × 10⁻⁵, 4.7 × 10⁻³, and 10−3 for the +0.25, +0.5, and +1 μg FH5 samples, respectively; at 7 h, P = 1.1 × 10⁻³, 2.9 × 10⁻³ and 3.2 × 10⁻⁴, respectively). Pollen tube-width comparison, which negatively correlates with growth quality (7, 17, 25), showed 0.25 μg FH5-transformed pollen tubes being slightly but significantly narrower than the controls (Fig. S3B), consistent with enhance growth quality. (B) Wide-field images showing the relatively subtle subapical actin structure in a control (arrow) and the substantially augmented structure in a +FH5 tube. The structures were elongating at 35 and 41.3 nm/s, respectively, over a 10-min period. The subapical actin structure signal intensity (SAC):distal cytoplasm signal intensity (Cyt) ratio was used as a measure for the prominence of the subapical actin structure. The SAC:Cyt ratio was 1.1 and 1.63 for the control and +FH5 tube, respectively. Fig. S3C shows details on SAC and Cyt analyses. (C) Percentage of tubes showing a prominent subapical actin structure (SAC:Cyt >1.15). Data shows average ± SD (n = 73–145 tubes analyzed for each sample). Differences from controls were significant (P = 10−4 and 2 × 10⁻³ at 4 h, 1.4 × 10⁻⁴, and 2.4 × 10−3 by 7 h for the +0.25 and 0.5 μg samples, respectively). The reduced percentage observed for the 7-h +0.5 μg FH5 sample reflected that many of the transformed tubes were already growth-inhibited and their subapical actin structure obliterated. Analyses in A to C established that 0.25 μg of Lat52::FH5 was optimum in obtaining the largest number of rapidly elongating transformed pollen tubes over the best growth period for observations (4–8 h after transformation) (3, 8, 36). (D) Wide-field coimaging of a FH5-Ch and actin reporter cotransformed pollen tube showing the spatial relationship between the subapical actin structure and the FH5-Ch–occupied apical dome membrane. (E) Whole-tube projections from confocal z-stack images of a control and a +FH5 tube. The frontal view (90°) and orthogonal sections of the +FH5 tube (1–6 taken at *, Right to Left) revealed a basket-shaped subapical actin structure anchored at the apical flank cortex, projecting centripetally to span the central cytoplasm at its base. (F) Medial sections of a +FH5 tube taken from a confocal time series (Movie S2). White lines show distance grown by a control tube for a comparable period (Movie S3), showing more rapid growth in the +FH5 tube (26.8 nm/s vs. 18.9 nm/s in the control). (G) Growth-rate comparison. Growth rates were averaged from control (n = 31) and +FH5 (n = 33) tubes individually monitored for durations of between 3 min and 1 h (with intermittent image acquisition) in several independent comparative experiments. Difference was significant (P = ∼5 × 10⁻³) and resulted from a higher percentage of FH5-transformed pollen tubes elongating at higher growth rates than controls (Fig. S3D). (H) SAC:Cyt intensity ratio comparison shows significantly more prominent subapical actin structures in FH5 transformed tube compared with controls (P = ∼4.7 × 10⁻⁷). Data were average ± SDs from the same samples analyzed in G. (Scale bars: 5 μm in E, 10 μm in all others.)

