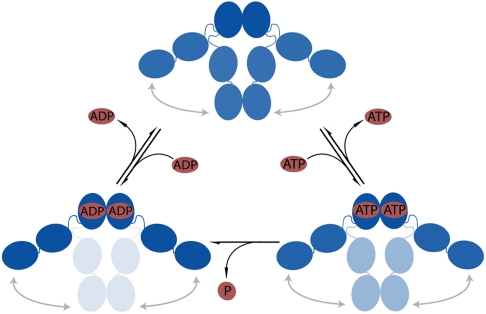
Fig. 8.
Model for the nucleotide dependent C-terminal association and dissociation. Dark blue represents high occupancy of the state, and medium and light blue represent a lower occupancy of the respective state. When ATP or ADP is bound, the equilibrium between the C-terminal open and closed states is shifted toward the open state. Additional schemes for the N-terminal mutants are shown in Fig. S8.

