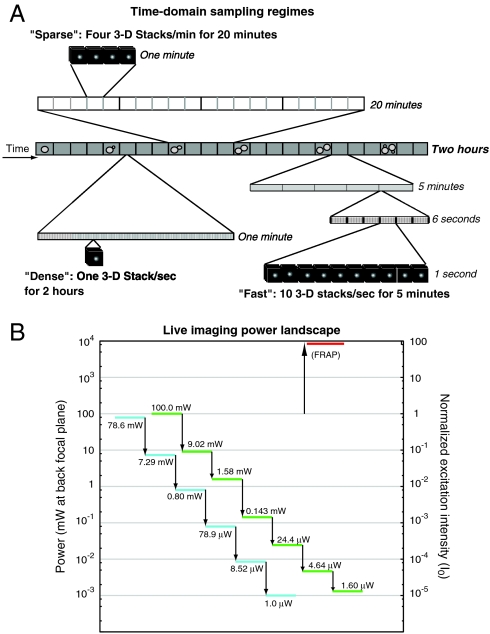
Fig. 1.
Overview of imaging conditions used in this study. (A) Sparse, dense, and fast time domain sampling regimes are shown to scale. (B) Power landscape showing the measured values of light intensity at the back focal plane for various attenuation values. Over 6 orders of magnitude of attenuation are possible. High-intensity light used for FRAP is shown at top right.

