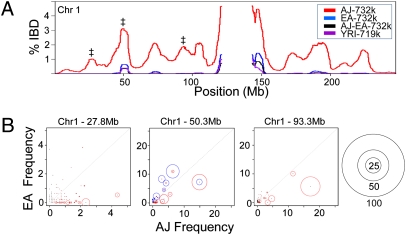
Fig. 3.
IBD and frequency of shared haplotypes. (A) The percentage of IBD for all pairs of individuals within the AJ, EA, and YRI populations is plotted for chromosome 1. Pairs consisting of one Ashkenazi Jew with one European American (AJ-EA) were also analyzed. The symbol ‡ mark the three loci whose haplotype frequencies are analyzed in B. (B) The 100-SNP haplotype blocks centered at three loci marked in A were analyzed for their frequency in the AJ and EA population. Red circles represent the haplotypes identified with IBD in the AJ population and the size of the circle indicates the frequency that the haplotype is shared (i.e., 50 indicates that the given haplotype is shared by half of the AJ pairs with IBD at that locus). The scale of the circles is given on the far right. (Center) Blue circles represent the haplotypes with IBD in the EA population.

