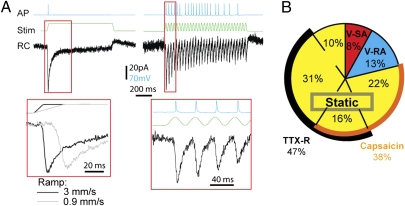
Fig. 5.
RC recordings in vitro. (A) Sensory neurons generate RCs during both static (Left) and vibration (Right) stimulation in the presence of TTX. AP firing profile and corresponding RCs during static stimulation of different ramping speeds (Lower Left) and 30-Hz vibrational stimulus (Lower Right). (B) Proportion of main mechanosensitive sensory neuron populations as identified with the techniques introduced in this article. Pie chart with percentages of sensory neurons responding to the stimuli indicated, and the sensitivity of their subpopulations to TTX or capsaicin.

