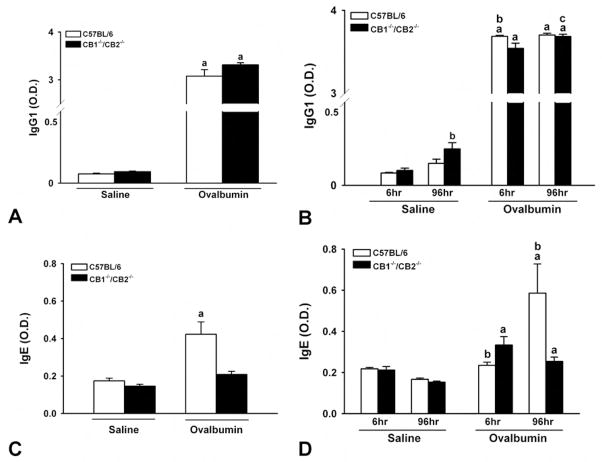
Figure 5.
Ovalbumin (OVA)-induced specific IgE and IgG1. Plasma was collected from saline- or OVA-treated wild-type or CB1/CB2 null mice on day 17 (A, C) or at necropsy (B, D). OVA-specific plasma IgE and IgG1 were enumerated by enzyme-linked immunosorbent assay. Plasma was diluted 1:1,000 for IgG1; further dilution to 1:10,000 did not alter the outcome. (a) p < .05 versus respective saline. (b) p < .05 treatment-matched genotype difference. (c) p < .05 treatment-matched time difference.

