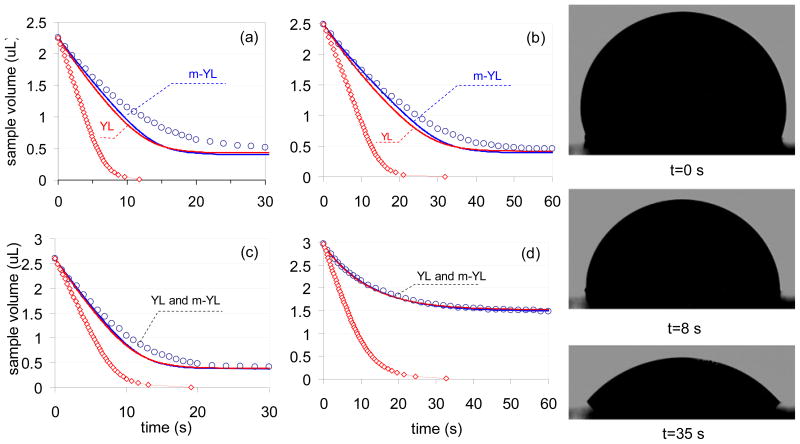
Fig. 4.
Comparison of the experimentally measured (○) and computed sample droplet volumes in four sets of experiments. The red and blue solid lines were calculated by utilizing the traditional Young-Laplace equation (Eq. 4a, labeled as YL) or its more complex form (Eq. 4b labeled as m-YL) in combination with Eq. 5, respectively. The red diamonds represent the computed results based on Berthier’s model.11 (a) 5.0 mm hydrophobic PDMS channel with 2.5 mm diameter reservoir port (b) 10.0 mm hydrophobic PDMS channel with 2.5 mm diameter reservoir port. (c) 5.0 mm hydrophobic PDMS channel with 3.3 mm reservoir port (d) 5.0 mm hydrophilic PDMS channel with 2.5 mm diameter reservoir port. (e) Images of sample droplets captured during the experiment shown in 4a.

