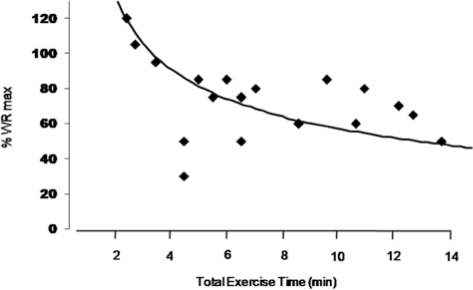
Figure 2.
Total exercise time (min) and total work rate (% WRmax) with continuous exercise training in studies with COPD patients of different disease severity. Each symbol represents a different exercise training intensity in patients with FEV1 > 40% predicted (refs:8,23,51,56,59) and FEV1 < 40% predicted (refs: 26,55,57,58).

