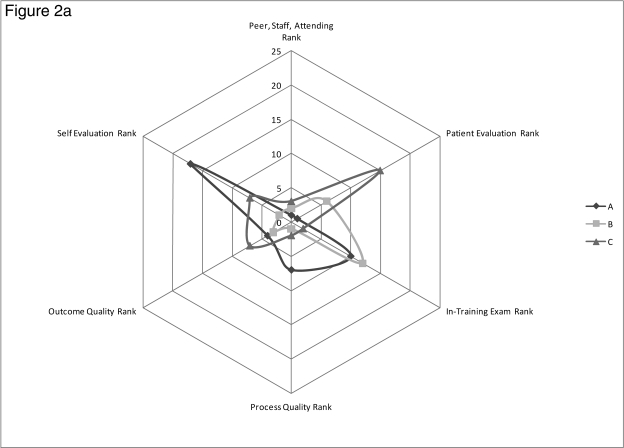
Figure 2.
Radar Graphs for Overall Rankings for Each of the Major Multisource Feedback Categories
A, Ratings for residents A through C. B, Ratings for residents H, L, and Q. C, Ratings for residents T through V. Data points closer to the center of the graph represent higher rankings than data points closer to the edge.

