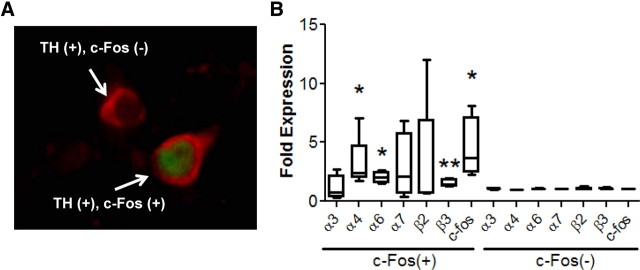
Figure 2.
Differential nAChR subunit gene expression in alcohol-activated versus nonactivated DAergic neurons. A, Immunofluorescence image of a coronal midbrain slice from a C57BL/6J mouse challenged with 2.0 g/kg ethanol. Sections were immunolabeled to detect TH (red) expression to visualize DAergic neurons and c-Fos (green) expression to identify neurons activated by ethanol. Arrows point to two different cells, one, a TH-immunopositive c-Fos-immunonegative neuron [TH (+), c-Fos (−)] and the other a TH-, c-Fos-immunopositive neuron [TH (+), c-Fos (+)]. B, Fold change of nAChR subunit gene expression, as measured by qRT-PCR, in TH-, c-Fos-immunopositive (left) neurons compared with TH-immunopositive, c-Fos-immunonegative neurons (right). Neurons were captured via LCM. TH-, c-Fos-immunopositive neurons n = 2298 and TH-immunopositive, c-Fos-immunonegative n = 3645. *p < 0.05, **p < 0.01, paired t test.

