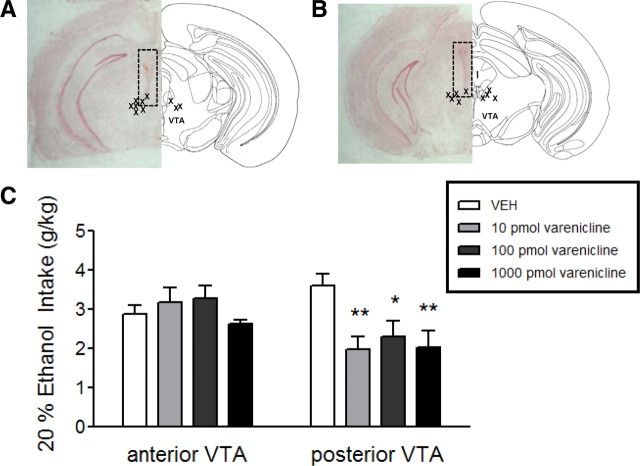
Figure 4.
Alcohol intake after varenicline infusion into anterior or posterior VTA. A, Left, representative neutral red stained coronal brain slice from a mouse with a guide cannula placed just dorsal to the anterior VTA (dotted box). Right, schematic diagram of anterior VTA −3.08 mm from bregma (adapted from Paxinos and Franklin, 2000). X's represent guide cannula placements within the anterior VTA. B, Left, representative neutral red stained coronal brain slice from a mouse with a guide cannula placed just dorsal to the posterior VTA (dotted box). Right, schematic diagram of posterior VTA at bregma −3.52. X's represent guide cannula placements within the posterior VTA. C, Ethanol intake (20%) after infusion of aCSF, 10 pmol, 100 pmol, or 1000 pmol of varenicline in either the anterior or posterior VTA (n = 9–10/brain region). *p < 0.05, **p < 0.01.

