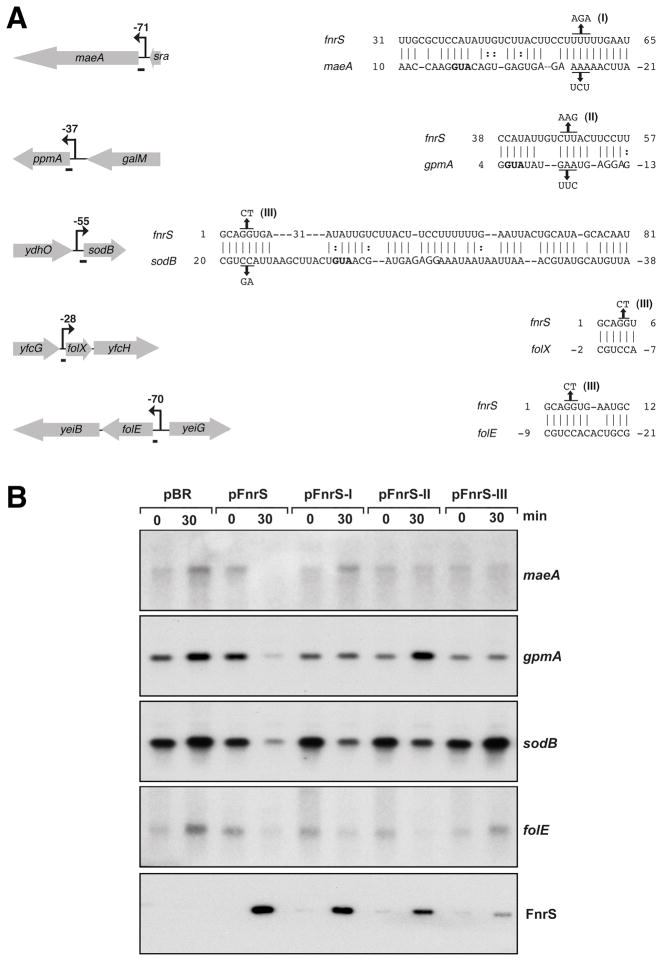
Fig. 5. Base pairing between FnrS and target mRNAs.
A. Predicted base pairing interactions. Black arrows indicate the promoters mapped by 5′ RACE PCR, and the numbers correspond to the number of nucleotides between the transcriptional and the translational start sites. The regions of base pairing between FnrS and its targets as predicted by the TargetRNA program are symbolized by short bars on the left and are given on the right. FnrS mutations I, II and III are also indicated. The ribosome binding sites are italicized and the start codons are in bold. The sequences of the compensatory mutations are also given.
B. Repression of maeA, gpmA, sodB, folE expression by FnrS and FnrS mutants. Total RNA was extracted from MG1655 before and 30 min after the induction of FnrS (from pBR-FnrS) or FnrS mutant I, II or III (pBR-FnrS-I, II or III) with 100 μM IPTG. Genes probed are indicated on the left. The last panel shows the levels of the wild-type and mutant FnrS transcripts. The Northern blots were carried out as in Fig. 2 and 4.

