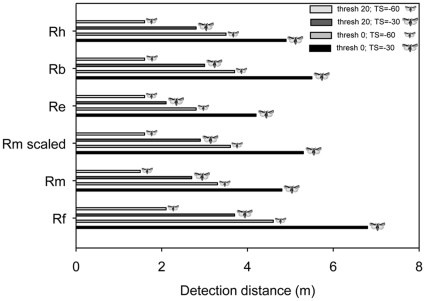
Figure 5. Estimated maximum prey detection distances for the five European species of horseshoe bat.
The dark grey bars indicate maximum detection distances for large insects (target strength (TS) = −30 dB) for either an echo perception threshold (thresh) of 0 dB SPL or 20 dB SPL; the light grey bars show maximum detection distances for small insects (target strength (TS) = −60 dB) for either an echo perception threshold of 0 dB SPL or 20 dB SPL. Calculations were based on average maximum call intensities and an average peak echolocation call frequency as measured in this study. Species abbreviations as in the other figures. ‘Rm scaled’ indicated detection distances R. mehelyi would experience if the species called at the intensity we measured, but at a frequency as predicted by allometric scaling (97 kHz instead of 108 kHz).

