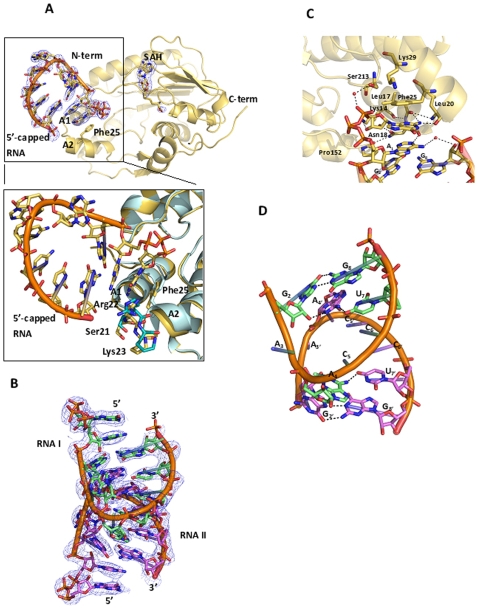
Figure 1. Interactions of the 5′-capped RNA with the MTase.
(A) Cartoon representation of one MTase monomer with bound RNA octamer and SAH. The Fo-Fc omit electron density map (where both the RNA chain and the SAH have been omitted from the phase calculation) is contoured at a level of 2.5 σ. The SAH co-product, 5′-capped RNA and residue Phe25 are shown as sticks. The inset shows a comparison between RNA bound (yellow) and free (cyan) MTase monomer, highlighting the conformational changes occurring upon RNA binding (see text) (B) Structure of the RNA dimer as observed in the MTase-5′-capped RNA complex. The 2Fo-Fc electron density map is contoured at 1.5 σ. (C) Cartoon representation of G0pppA1-RNA interacting with residues at the GTP binding site. Water molecules are represented by red spheres. Dotted lines represent hydrogen bonds. Protein residue numbers and bases are also given. Prime numbers indicate RNA bases related by the 2-fold ncs. (D) Cartoon representation of the two RNA chains present in the asu, G2A3A4C5C6U7G8 (carbon atoms in green) and G2′A3′A4′C5′C6′U7′G8′ (RNA strand related by 2-fold ncs axis; carbon atoms in magenta) Eight non-canonical base-pairs are observed. The A3 and A3′ moieties of the RNA flip out of from their respective RNA chain.

