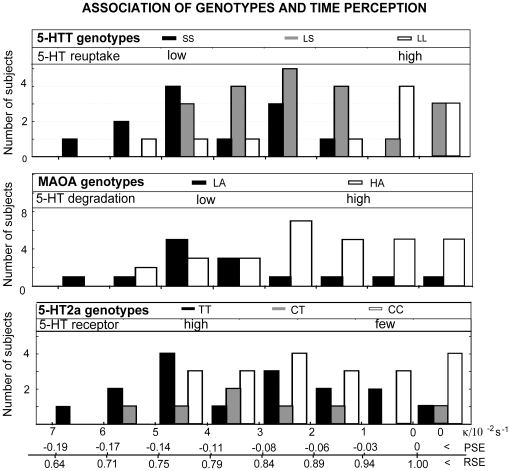
Figure 2. Association of genotypes and time perception.
The distribution of 5-HT-related genotype carriers (vertical boxes of different shadings, number of subjects) in relation to the duration discrimination parameters, namely  , PSE and RSE (lower horizontal line) is shown. The predominance of SS genotype of 5-HTT gene, LA genotype of MAOA gene and TT genotype of 5-HT2a gene, i.e., genotypes related to higher 5-HT transmission, is clearly seen for the subjects with more negative PSE, and corresponding
  and RSE values.

