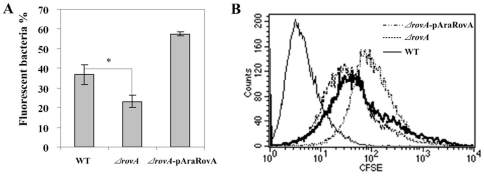
Figure 8. Cell membrane permeability to CFSE is lowered in the ΔrovA mutant.
Strain 201, the ΔrovA mutant and ΔrovA-pAraRovA were incubated with 1 µM CFSE for 10 min and subjected to flow cytometry analysis. The percentages of fluorescent bacteria are shown as means ± standard deviation of three replicate experiments (A). Bacteria stained by CFSE for wild type (solid line), ΔrovA mutant (dotted line) and ΔrovA-pAraRovA (dashed line) were shown by histograms. Data are representative of 3 independent experiments. The difference between the wild type and the ΔrovA mutant were calculated using Student's t test and p<0.05 (p = 0.02, indicated as *) was taken as statistically significant.

