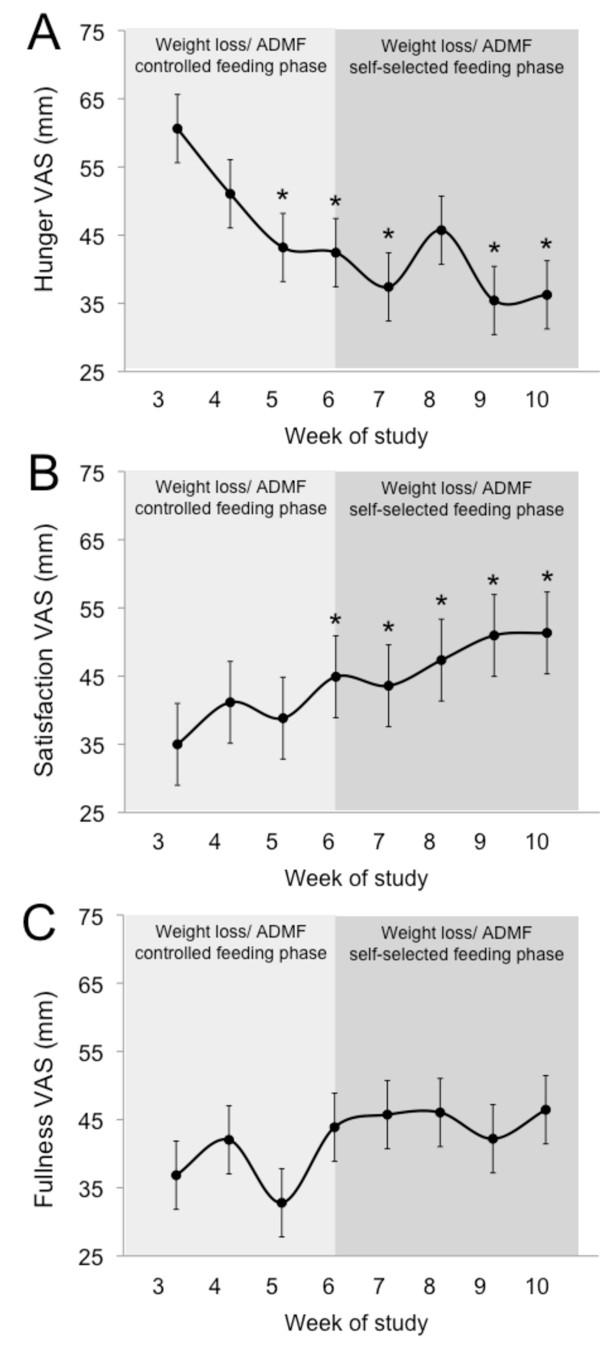
Figure 3.
Hunger, satiety and fullness during each phase of the trial. Values reported as mean ± SEM. A. Hunger scores at each week of the study. B. Satisfaction with diet scores at each week of the study. C. Fullness scores at each week of the study. *P < 0.05, relative to week 3 (One-factor ANOVA with Bonferroni analysis).

