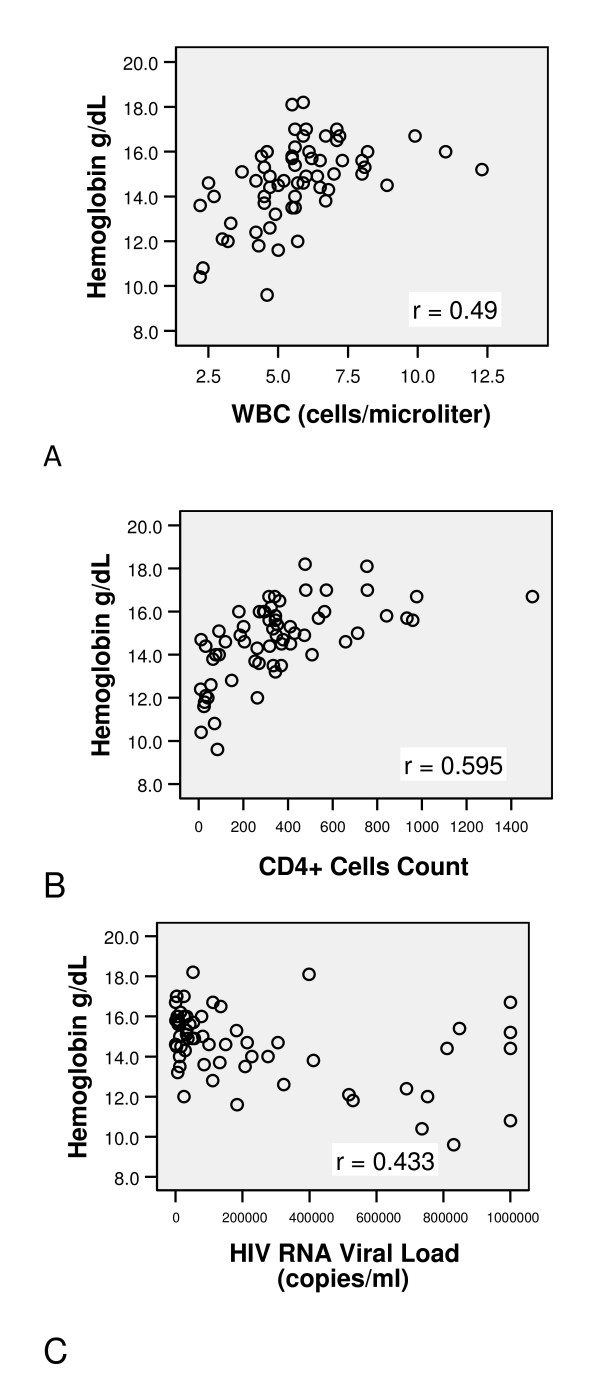
Figure 1.
Interrelationship between hemoglobin and risk factors. A. This figure shows a moderately strong, positive correlation between WBC and hemoglobin (r = 0.49, P < 0.001). B. This figure shows a moderately strong, positive correlation between CD4+ cells count and hemoglobin (r = 0.595, P < 0.001). C. This figure shows a moderately strong, negative correlation between HIV RNA viral load and hemoglobin (r = - 0.433, P < 0.001).

