
Figure 5. Effect of exogenous hydrogen peroxide (H2O2) treatment on ethanol induced histone H3 acetylation in hepatocytes.
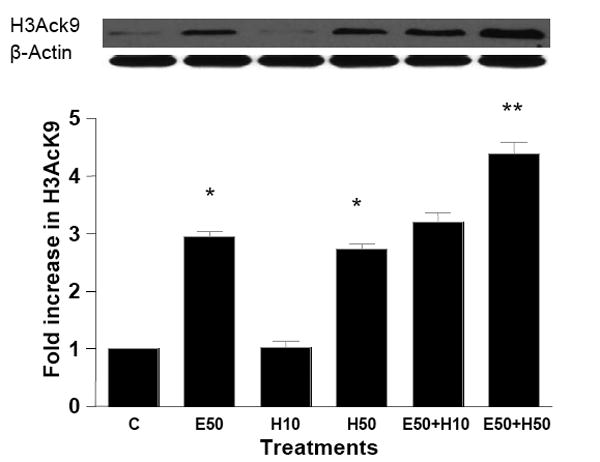
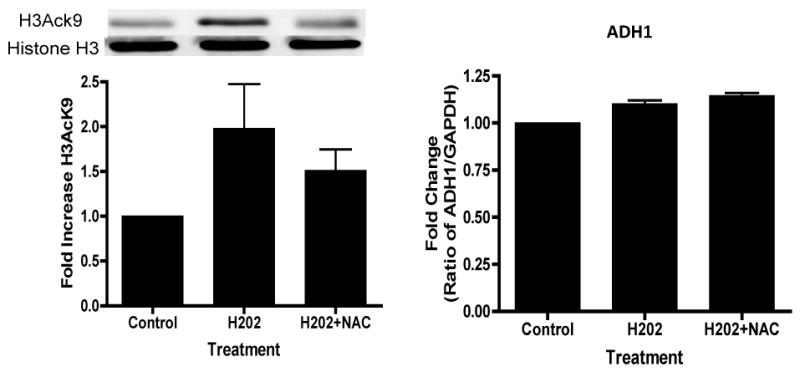
(A) Hepatocytes were pretreated with H2O2 (10 or 50 μM H2O2) for 1 hr. Subsequently, cells were stimulated with 50 mM ethanol for 23 hr. Acetylated histone H3 at lys9 was measured as described in the Materials and Methods and Fig. 2. Values represent the mean of 3 separate experiments, with the ±SE indicated by vertical lines. Values represent as fold increase compared to control (C=Control; E50=50 mM Ethanol; H10=10 μM Hydrogen peroxide; H50=50 μM Hydrogen peroxide; E50+ H10=50 mM Ethanol+10 μM Hydrogen peroxide; E50+ H50=50 mM Ethanol+50 μM Hydrogen peroxide). *p<0.001 (C compared to E50 and H50), **p<0.001 (E compared to E50+ H50). (B) Hepatocytes were treated with 50 μM H2O2 for 24 hrs in the presence or absence of NAC (10 mM) and the levels of H3AcK9 or ADH1 mRNA were monitored.