
Figure 6. Effect of mitochondrial respiratory chain inhibitors on ethanol induced histone H3 acetylation in hepatocytes.
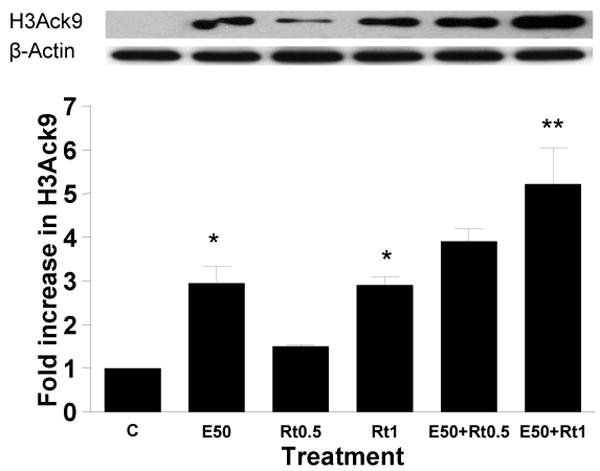
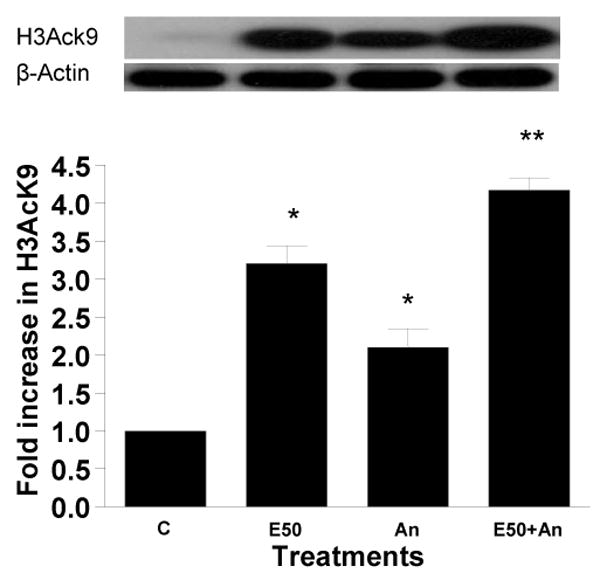
Hepatocytes were pretreated with a) rotenone (0.50 μM or 1 μM) and b) 0.025 mM antimycin for 1 hr. Then cells were treated with 50 mM ethanol for 23 hr. Equal amounts (40 μg) of nuclear extract were used for Western blot analysis to detect acetylated histone H3 at lys9. Quantitative analysis of acetylated histone H3 was performed by densitometric analysis and is presented as mean ± SE (bar), n = 3 experiments. A representative blot is also shown. Values represent as fold increase compared to control (C=Control; E50=50 mM Ethanol; Rt0.5=0.5 μM Rotenone; Rt1=1 μM Rotenone; E50+ Rt0.5=50 mM Ethanol+0.5 μM Rotenone; E50+ Rt1=50 mM Ethanol+1 μM Rotenone; An=0.025 mM Antimycin; E50+An=50 mM Ethanol+0.025 mM Antimycin) a) *p<0.05 (C compared to E and Rt1), **p<0.01 (E compared to E+ Rt1)