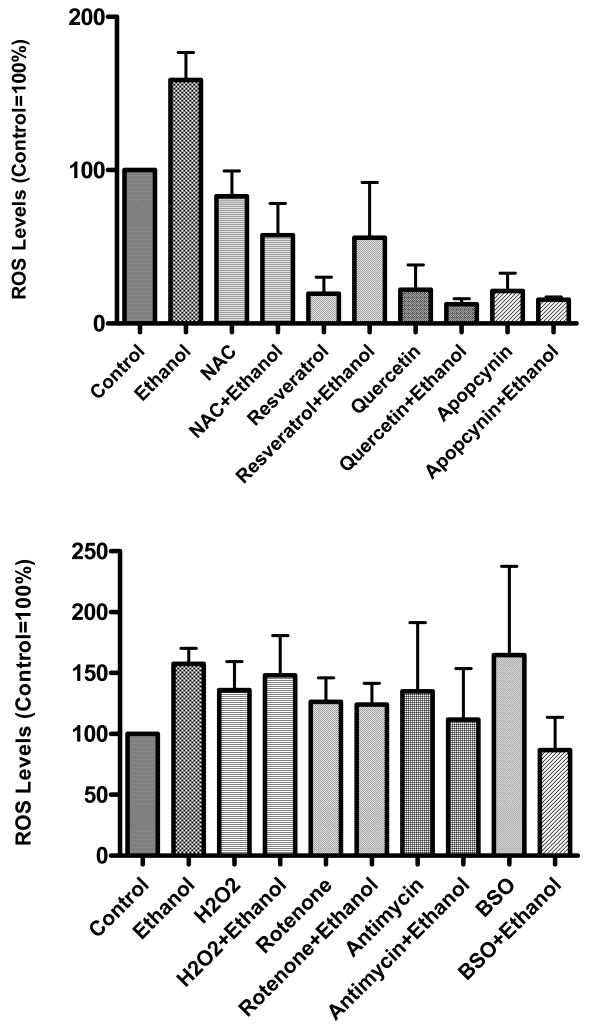
Figure 8. Levels of ROS in hepatocytes treated with anti- and pro-oxidants in the presence and absence of ethanol.
Primary culture of hepatocytes were treated with various antioxidants (top panel) or pro-oxidants (bottom panel) for 1 h. Ethanol (50 mM) was then added and cells grown for 23 hr. Levels of ROS were determined using DCF dye as detailed in the Methods section. Results are mean ± SEM (n=3 experiments). The concentration of various antioxidants used in Fig. 8 top panel: Apocyanin, 1 mM; NAC, 10 mM; Quercetin, 5 mM; Reseveratrol, 0.5 mM. Concentrations used for pro-oxidants in Fig. 8 bottom panel were as follows: Antimycin, 25 μM; BSO, 1 mM; H2O2, 50 μM; Rotenone, 1 μM.

